Essay #4: Modeling Returns from Yields: Daily Frequency Treasury Returns Since 1962
Black Monday, Black Tuesday, & Telling Stories With Models

PDF of Essay
I’m experimenting with a few writing formats; if reading/printing a PDF is easier for you, please use this link.
Table of Contents
I. Motivation
II. Modeling Method
III. Results: Black Monday & the Nixon Shock
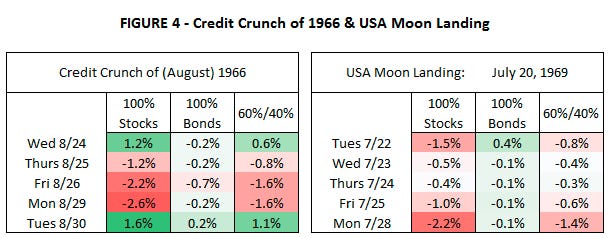
IV. Results: Significant Events of the 1960s
V: Validation of Results
Appendix A: Version Control / GitHub
Appendix B: On Telling Stories With Models
I. Motivation
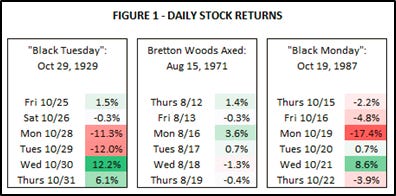
How would a hypothetical {60% USA Stocks, 40% USA Bonds} benchmark portfolio have performed during Black Monday? What about Black Tuesday?
How would 60/40 have performed during the days following the 1971 “Nixon shock”, when President Nixon suspended the USD convertibility to gold and effectively ended Bretton Woods?
Answering the “60% stocks” component of those questions is easy – publicly & freely available models of daily frequency stock returns exist going all the way back to 1926, at least for the USA. Prior to 1926 you’re restricted to monthly frequency models. Figure 1 below shows a few daily USA returns of interest:
Answering the “40% bonds” component of those hypotheticals is more difficult. Data is messier and is less publicly available. Plenty of index providers, to which you’d have to pay to access, do not publish daily frequency bond prices as far back as 1971.
There are numerous modeling questions to consider with bonds that take greater prominence than with equities, especially regarding liquidity. Importantly, bond prices provided by index providers might not be marked to market and are often based on prices of comparable securities.
One solution is to use daily frequency yields provided by FRED and derive a model of prices; that’s what we’ll create.
II. Modeling Method
The method by which we’ll convert yields to prices is described in footnote 5 of Essay #2:
“The ‘10-Year US Treasuries’ series represents the return on a hypothetical constant maturity index of treasury bonds, rebalanced monthly; that is, at the end of each month, the previous 10-year bond is now a 9.9167-year bond, which we sell (at a yield determined by interpolation of available data), and proceed to purchase a new bond whose yield matches that of that day’s published 10-year rate.”
For daily frequency yields, the process is the same.
Sample code that implements the above is here.
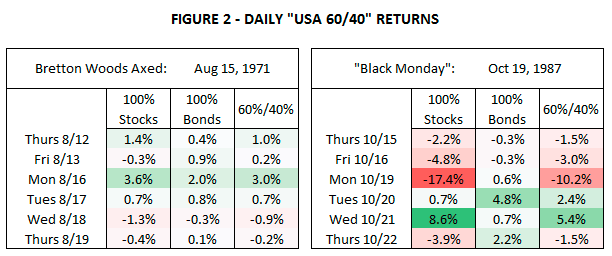
III. Results: Black Monday & the Nixon Shock
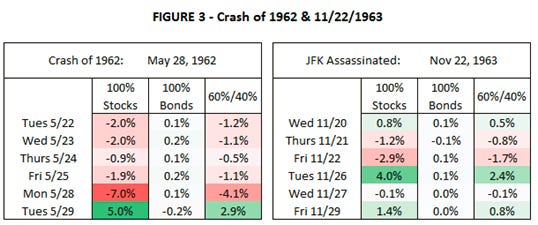
IV. Results: Significant Events of the 1960s
V. Validation of Results
A common theme in these essays thus far is “what data is publicly & freely accessible”.
The methodology described in Section II mirrors the construction of returns in GFD and the Ibbotson Yearbook, though GFD & the CFA Institute only publish these returns at monthly and yearly frequencies.
If you or your institution are already shelling out money for these data sources, that’s one avenue you could pursue to validate the data models created for this essay.
But if daily returns are what you’re after, you will have to put on your modeling/creativity hat and perform some similar Symbol Manipulation as what’s described in this Essay.
The modeling choices you make should be different if your use case is different.
Reminder: the daily yields published by FRED and treasury.gov are only a model (interpolation) of prices.
Be on the lookout for a future essay describing a model of daily frequency bond returns from 1926-1961 (motivation: what about Black Tuesday?)
Appendix A: Version Control / GitHub
Any code, data, and other artifacts produced for this essay will be saved at https://github.com/kyle-binder-essays/essay_repo1/tree/essay_04.
Don’t forget requirements.txt, for this essay the bond_pricing package is needed for that fixed income price math.
Reminder from Essay #1: for best practices on including a requirements.txt file, see: What is the Python requirements.txt.
Appendix B: On Telling Stories With Models
It’s very tempting to extract a story from models.
Especially in 2021, I would not blame anyone for inferring from Figure 2 "of course BOTH stocks and bonds increased after the Nixon shock, because those stocks and bonds were denominated in US dollars, and Nixon's decision devalued the dollar".
Resist that urge.
Accept that we know less than we think we do.
Does price follow narrative, or does narrative follow price?
It's ALWAYS been the latter.